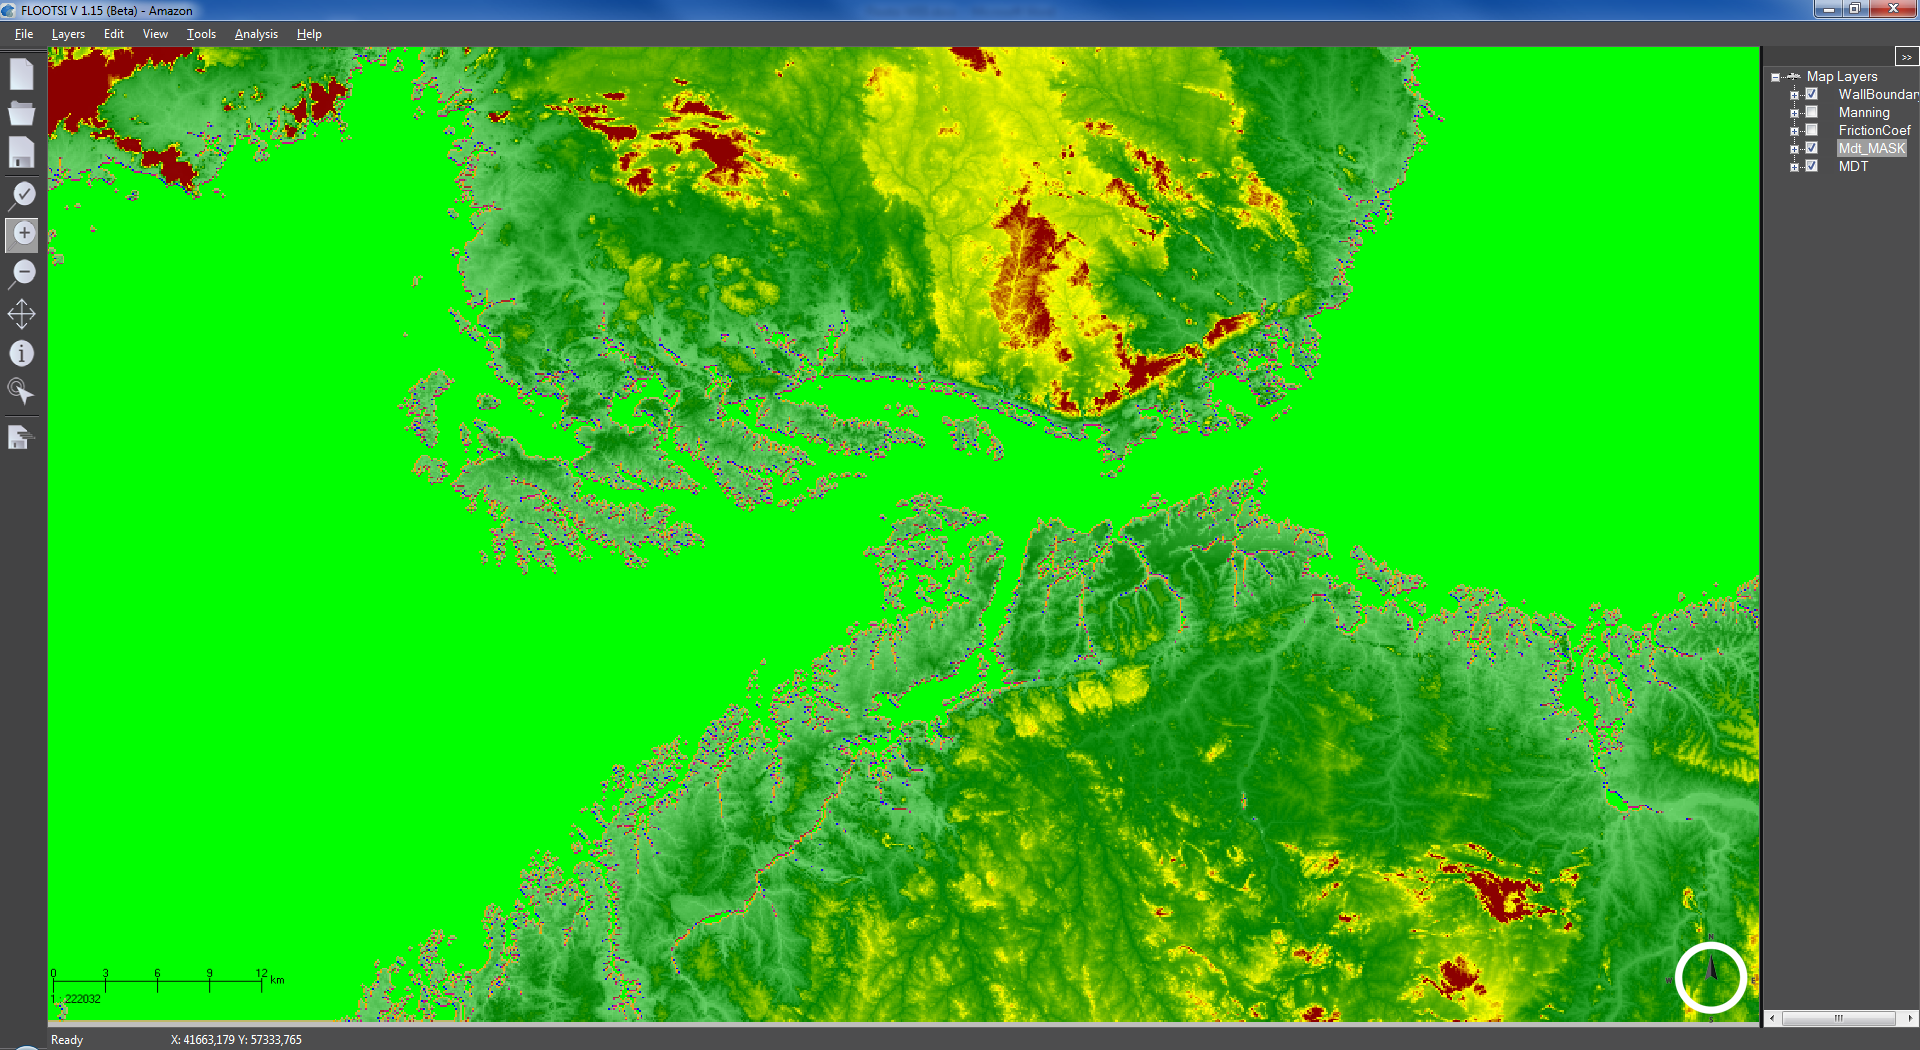
FLOOTSI GUI is the system responsible for pre and post processing of the data. It is a GIS system able to represent data in 2D and 3D.
FLOOTSI mainly works on a Digital Terrain Model (DTM). A DTM is a raster layer (Regular GRID) that contains in every GRID cell the georeferred height of the terrain in where the simulation will take place
Main features
FLOOTSI is a layered GIS system that can read most of the standard formats ion the market (vectorial, satellite and raster). Its main features are:
- Read and Write vectorials, satellite images and Rastes Layers.
- Open WMS Layers.
- Resample and SuperSampling Raster Layers.
- Expand, Export and Union Raster Layers.
- Import From XYZ GRID and STL Layers.
- Project and Reproject Layers.
- Edit Raster Layers.
- Copy Cell Values from Neighbor Cell.
- Smooth Raster Layers.
- Copy/Paste Raster to Raster.
- Create Vectorial Contour Curves from Raster.
The most important features of the pre-process are:
- Create raster Mask from DTM Raster to define the simulation area
- Create Friction Coefficient.
- Create Wall Boundary.
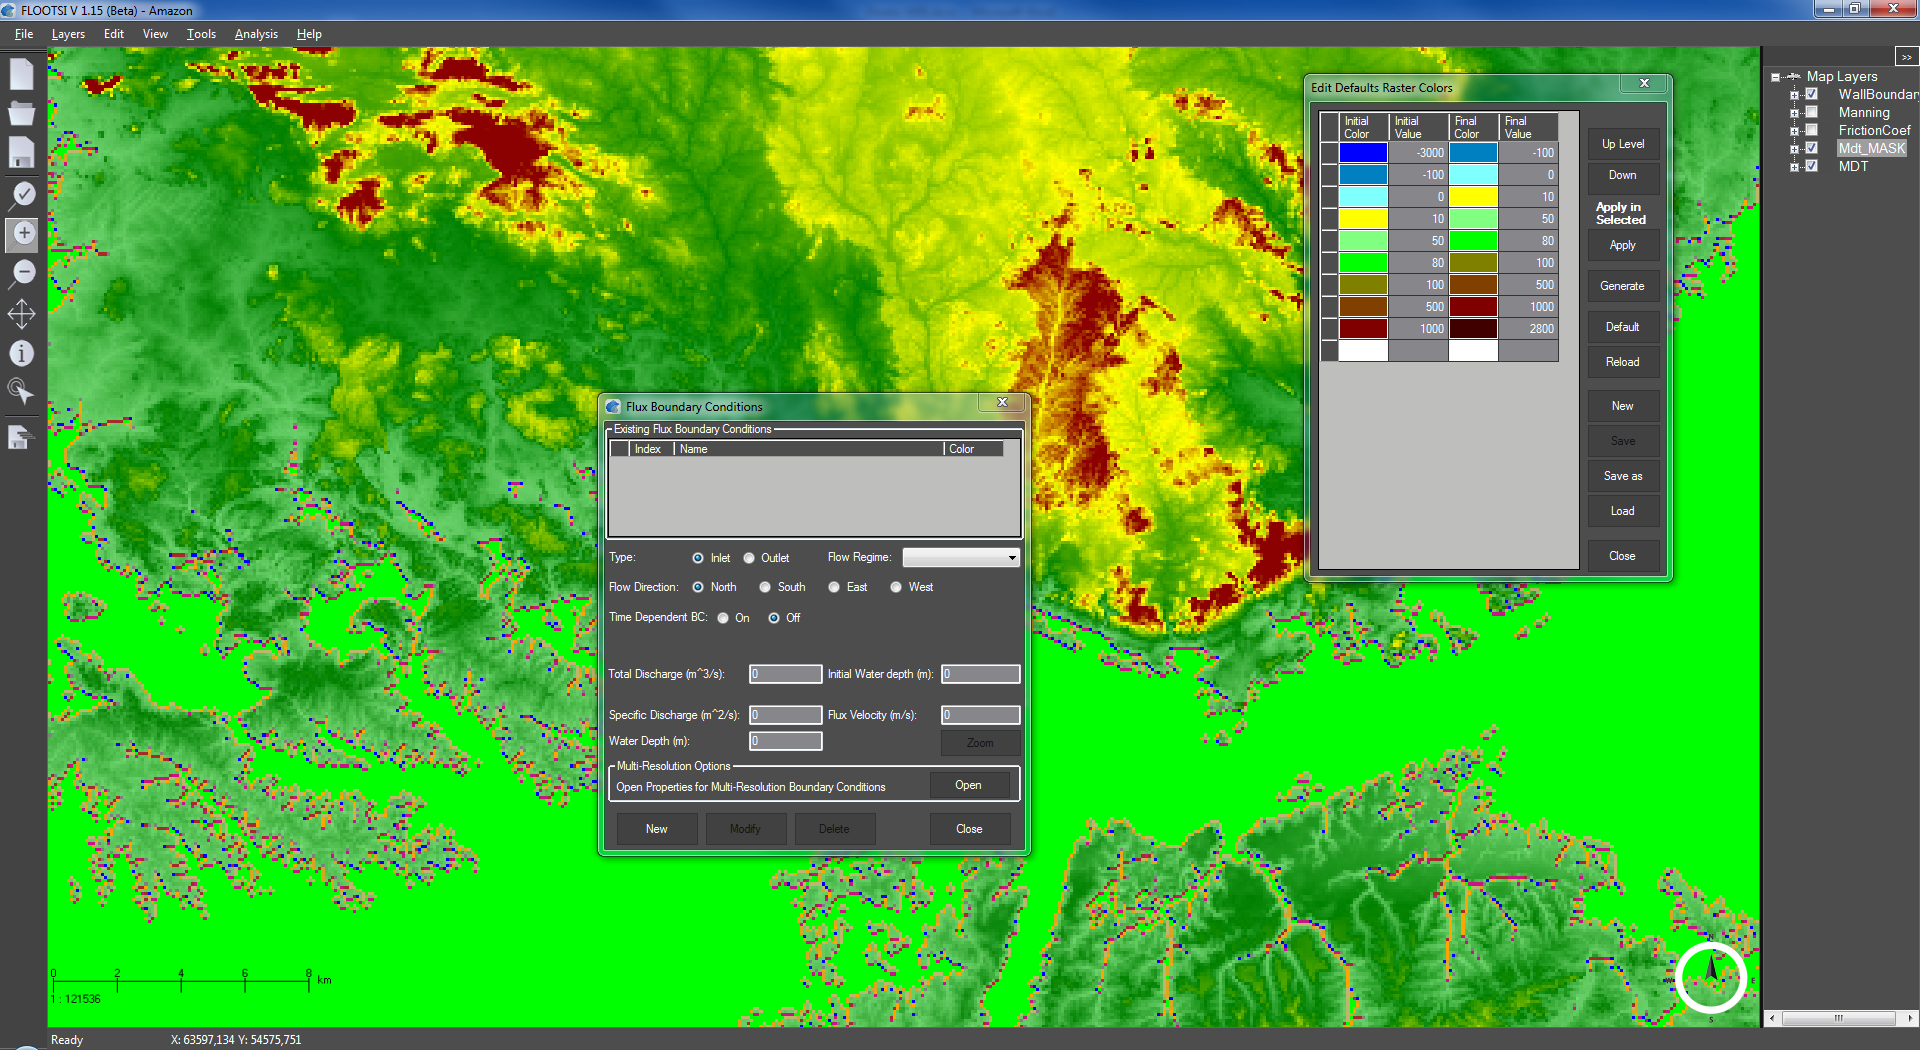
- Flux Boundary Conditions Tool.
- General Data Tool.
And the most important features of Post-process are:
- Load simulation result Layers.
- Create and View Video from simulation layers.
- Elevation Graph Tool.
- Time-dependent Graph tool.
- Create and View Velocity Vectors.
- Create and View Velocity Contour Fill
- Distance, Area, Volume, Flow Rate tools.
- View Results in 3D Viewer.
- Run and View 3D Simulations results.
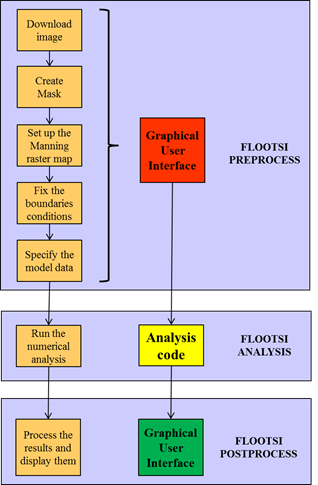
FLOOTSI WorkFlow
The following figure shows the workflow in FLOOTSI for calculating a simulation.