The main idea here was to test the FLOOTSI code to a real-world event, the Okushiri 1993 tsunami, for which laboratory experiments were also performed as part of the set of benchmark problems used in the 2004 Catalina Island workshop (Liu et al., 2008). The laboratory experiments of runup in the Monai Valley were conducted, aimed at reproducing and better understanding the coastal impact of the Okushiri tsunami. This experiment was modeled here as part of a validation benchmark.
The laboratory model of Monai at a 1/400 scale was constructed in a 205 m-long, 6 m-deep, and 3.5 m-wide tank at Central Research Institute for Electric Power Industry (CRIEPI) in Abiko, Japan and partly shown in Fig. 1. The laboratory setup closely resembles the actual bathymetry.
The incident wave from offshore, at the water depth D = 13.5 cm is known. There are reflective vertical sidewalls at X = 5.5, Y = 0 and 3.5 m (Fig. 1). The entire computational area is 5.448 m x 3.402 m, and the recommended time step and grid sizes for numerical simulations are Cell Size = 1.4 cm and dt = 0.05 sec.
The Tesla K40 used for this research was donated by the NVIDIA Corporation.

Figure 1 depicts the coastal topography of the complex three-dimensional beach.
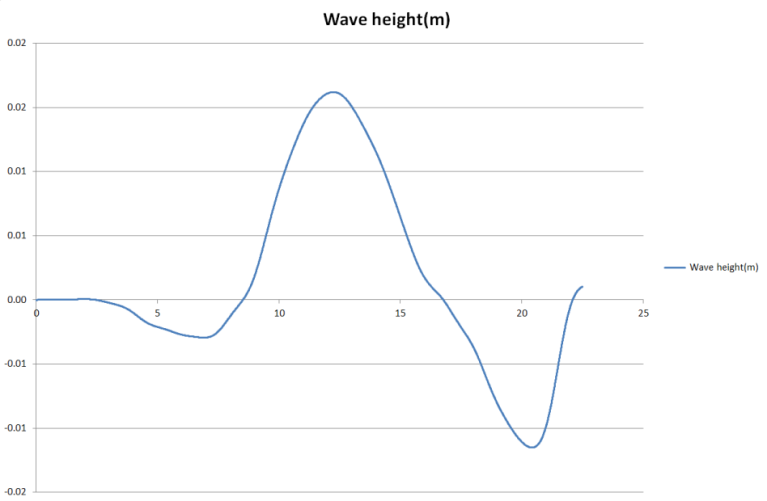
Figure 2 depicts the initial wave profile [ Height(m) -Time(s) ] for Monai Valley experiment.

Figure 3 depicts the comparison between the gauge 1 (4.521 m, 1.196 m) and the numerical results of the two nearest points.
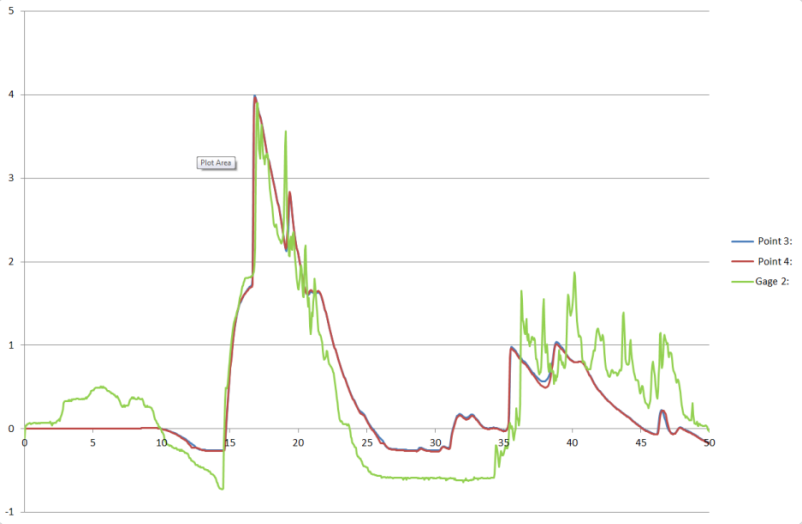
Figure 4 depicts the comparison between gauge 2 (4.521 m, 1.696 m) and the numerical results of the two nearest points.
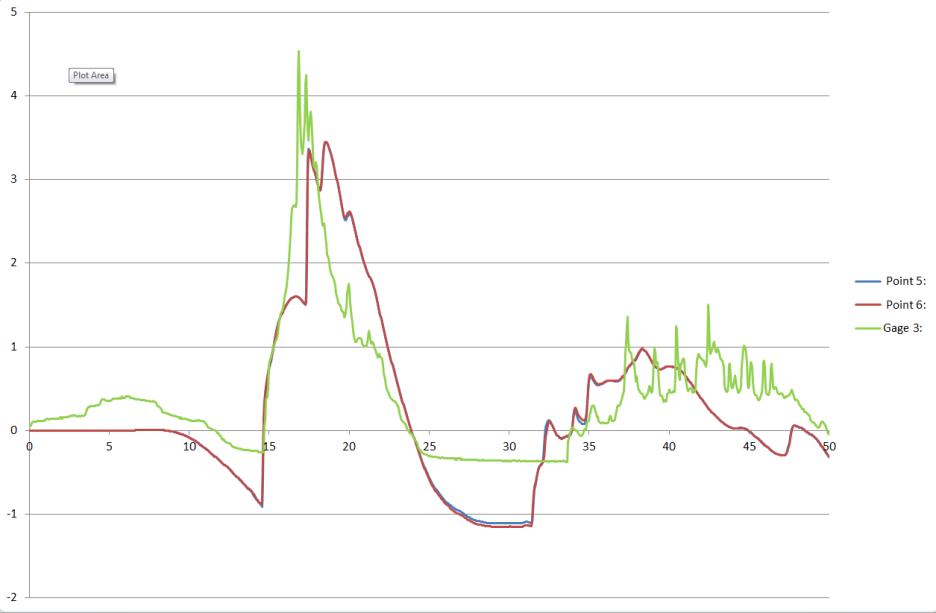
Figure 5 depicts the comparison between the gauge 3 (4.521 m, 2.196 m) and the numerical results of the two nearest points
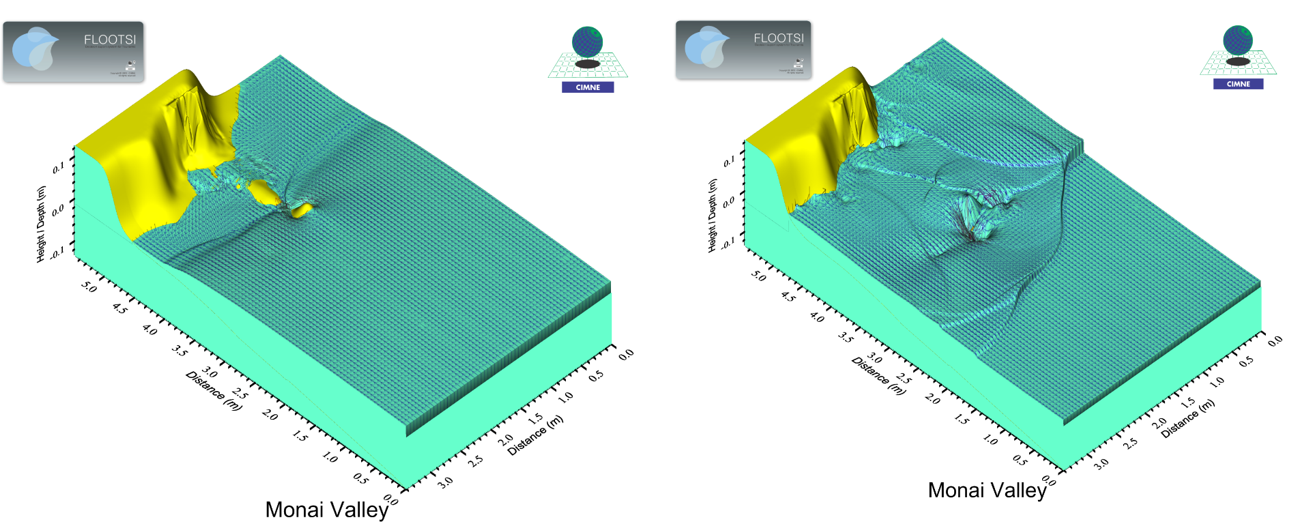
Figure 6: depicts two stages of the time evolution of the tsunami hitting over the coast and surrounding the island. Sometimes the island is covered totally by water and produces dimples in the water surface caused by underwater vortices.
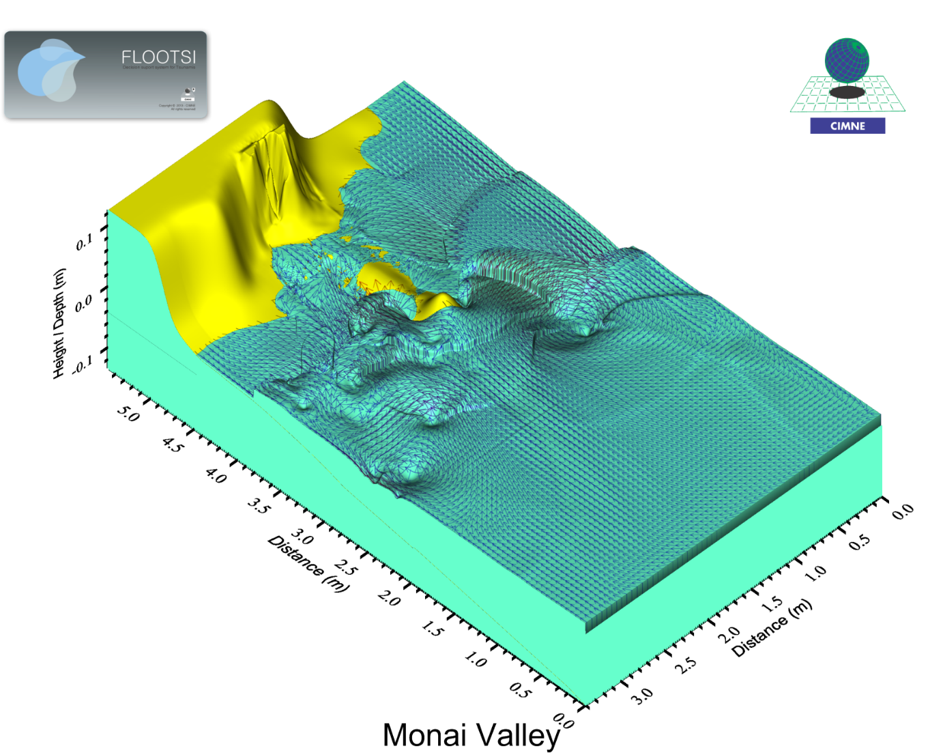
Figure 7: the figure depicts a frame of the time evolution of the tsunami’s velocity field including the vorticity due to the presence of the island.
Figures 3, 4, and 5 depicts the comparison of experimental (Liu et al., 2008) and FLOOTSI’s results for wave gauges 1, 2 and 3 for the Catalina benchmark #2 of the Monai Valley.
The numerical results reproduce well the salient features of the tsunami-induced flow, particularly for the lower frequency components. The time of initial wave impact and that of arrival of the reflected wave match the experimental values quite well.